Cold Email Open Rate Benchmark: What Is Good in 2026

Cold email open rate benchmarks are everywhere in 2026, and most of them disagree. Some platforms publish 42%, others publish 53%, and a few quote 30% to 50% as the broad band. The truth is that all of them are right for the sample they measured, and none of them is the number you should compare your own campaign against without context.
This guide pulls the current numbers from four large 2025 to 2026 studies (16.5 million to billions of cold emails between them), shows where they actually line up, and breaks the benchmarks down by industry, audience, sequence step, and send time so you can pick the one that matches your own send.
Cold email benchmarks at a glance
| Metric | Average in 2026 | Top performers | Notes |
|---|---|---|---|
| Open rate | 40% to 53% (42% Mailforge, 53% Woodpecker) | up to 90% | Falls to 31% to 32% on larger generic sends |
| Reply rate | 3.43% (Instantly), 5.8% (Belkins) | 10.7%+ | Top quartile starts at 5.5% |
| Bounce rate target | under 2% (Instantly) to under 7.5% (Mailforge) | under 1% | List quality is the biggest lever |
| Positive reply rate | ~2% | 4% to 6% | Meeting bookings around 1% |
| Unsubscribe rate | 2.17% | under 1% | Climbs to 2% by the 4th follow-up |
What counts as a good cold email open rate in 2026
The simplest answer is the one most reports give: a good cold email open rate in 2026 sits somewhere between 40% and 60%, with around 42% as the cross-industry average and 53% as the average on platforms that filter for narrow targeting. Top performers cross 90% on small, highly relevant lists.
Belkins, working with a 16.5 million email sample across 93 business domains in 2024, saw open rates start the year near 46% and settle at 31% to 32% by the back half of 2024. The slide is real, and it lines up with what most senders report: inbox fatigue, stricter mailbox-provider filters, and Apple Mail Privacy Protection inflating then deflating open numbers.
If your number is in the 30s, you are inside the current band for larger campaigns. If you are in the 50s, you are running the kind of tight, well-targeted send the top reports measure. Anything above 70% is usually a small list under 100 recipients, almost always with strong personalization.
Why a high open rate can mislead you
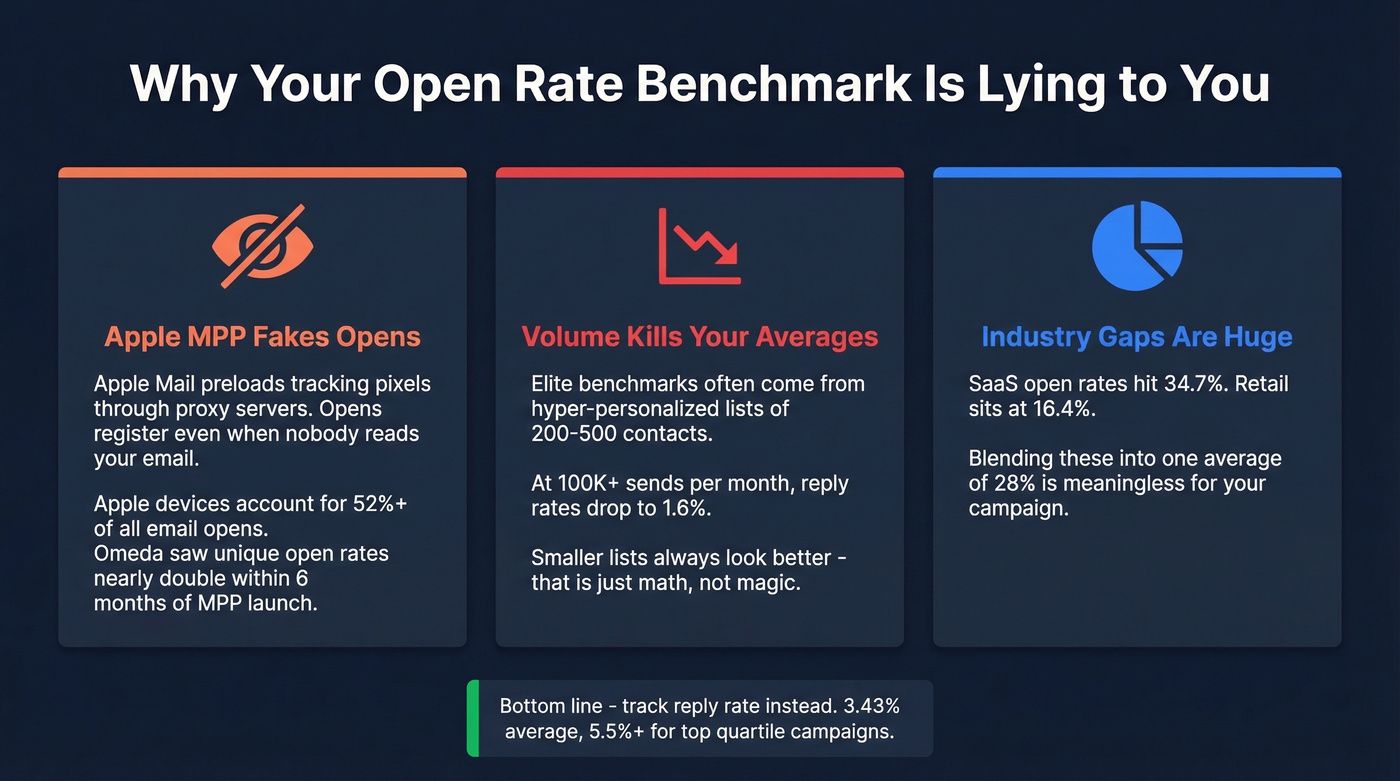
Open rate is the easiest metric to inflate and the least correlated with revenue. Three things distort it:
- Pixel tracking is noisy. Apple Mail Privacy Protection pre-fetches images, which counts as an open even when nobody read the message. Belkins flags this as the reason 2024 open numbers fell off after Apple tightened the policy.
- High open, low reply is normal. Woodpecker's data shows the platform average open rate sitting near 53%, while the same dataset shows reply rates in the 1% to 8.5% band depending on industry and targeting. A 90% open rate on a poorly targeted list still produces nothing.
- Subject-line gimmicks lift open rate without lifting interest. "Re:" prefixes, fake fwd: chains, and curiosity-bait subjects all push open rate up and reply rate down. The number on the dashboard goes green; the pipeline does not.
The rule of thumb most senders converge on: track open rate as a deliverability signal, not a campaign-quality signal. If it drops below 20%, you have a placement problem (the mail is hitting spam). If it shoots above 80%, you probably have a list-size or subject-line problem to investigate before you celebrate.
Reply rate is the number that matters
Reply rate is what the four big 2026 reports actually argue about. The numbers cluster tighter than open rate does:
- Instantly (billions of emails, 2025): average reply rate 3.43%, top quartile 5.5%+, elite tier 10.7%+.
- Belkins (16.5M emails, 2024): average reply rate 5.8%, down from 6.8% in 2023 (a 15% year over year drop).
- Mailforge (2026 benchmark): 3% reply rate average, 8% to 10% with personalization.
- Woodpecker (20M emails): 1% to 8.5% reply rate depending on industry and targeting quality.
The consensus: 3% to 6% is the broad-average band, 8% to 10% is where well-personalized campaigns sit, and anything above 10% puts you in the top tier across every dataset.
Reply rate also splits into quality tiers worth tracking separately. Positive replies (anyone interested, not just anyone responding) sit near 2%. Meeting bookings come in around 1%. If you optimize only for total replies you can game the number with "unsubscribe me" responses that count but do not pay.
Benchmarks by industry
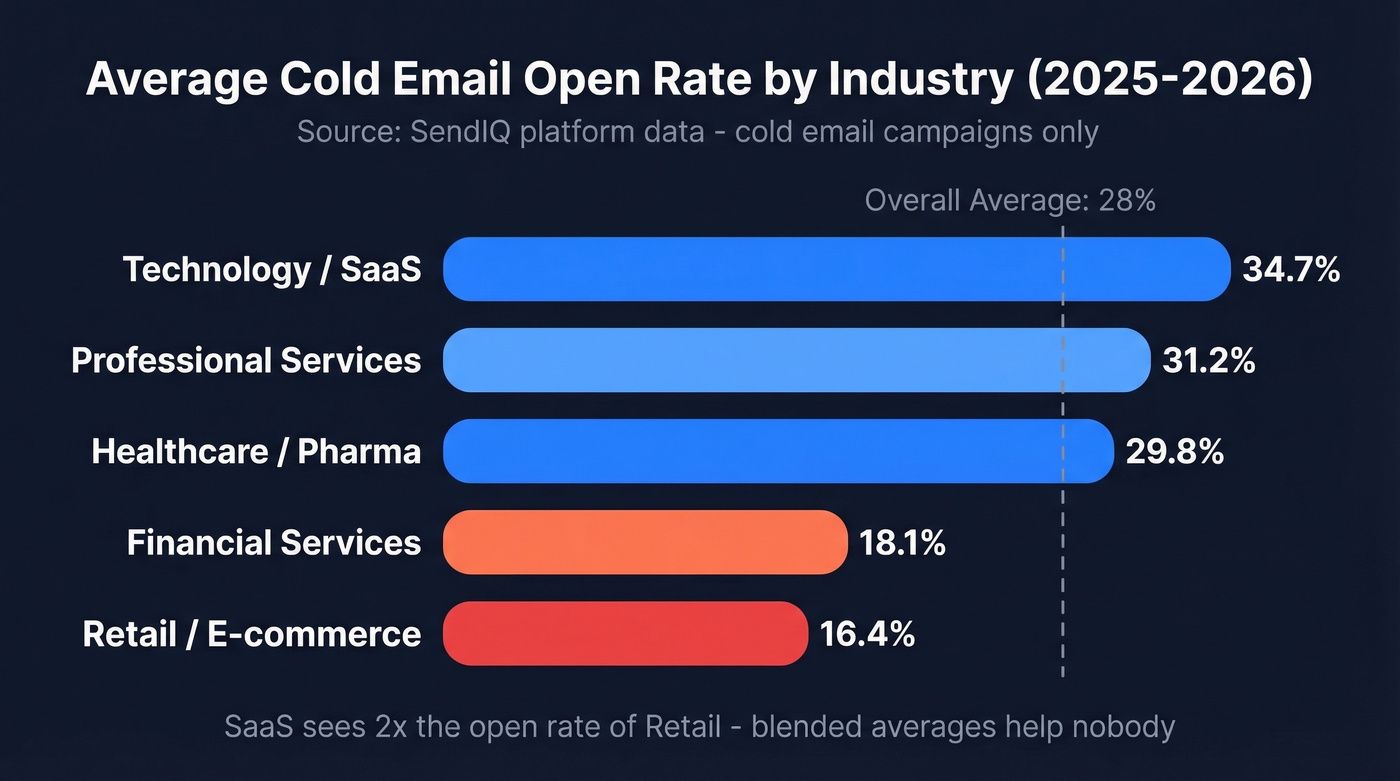
Industry is the single biggest swing factor in cold email benchmarks. From Mailforge and Belkins combined:
- Nonprofit and religious organizations: 59.70% open rate, 16.5%+ reply rate (the highest tier in the data).
- Solar, construction, and environmental services: 6.3%+ reply rate (top of the B2B band).
- IT consulting: 5.93% reply rate.
- Software development: 5.89% reply rate.
- IT services, biotechnology, financial services: 3.2% to 3.5% reply rate.
- Cloud solutions: 4.97% reply rate.
- Cybersecurity: 4.86% reply rate.
- Tech and software (broad SaaS): under 1.87% reply rate (the floor, driven by inbox saturation).
If you are selling into nonprofits, a 10% reply rate is mediocre. If you are selling SaaS into other tech companies, 3% is a strong number. Comparing yourself to a cross-industry average is almost always the wrong move.
Benchmarks by audience and company size
The Belkins study is the cleanest source on audience tiering, and the gaps between buyer personas are large.
- Entry-level professionals: 8% reply rate, 50% open rate (the easiest audience to reach).
- C-level executives: 5% reply rate, 30% open rate.
- Targeting one person per company: 7.8% reply rate.
- Targeting 10+ contacts per company: 3.8% reply rate (more than 2x worse).
- Companies with 11 to 50 employees: 8.2% reply rate.
- Companies with 5,000+ employees: approximately 5% reply rate.
Woodpecker's data backs the same direction: a 100-person campaign at a 40% reply rate (40 replies) beats a 1,000-person campaign at a 2% reply rate (20 replies). Small focused lists win on every dimension, but the win evaporates if half the addresses are stale, which is why verifying the list before each send sits upstream of every other benchmark.
Benchmarks by sequence length and follow-ups
Follow-ups change the math more than almost anything else you can adjust. The numbers from all three studies agree on the shape, even though specific percentages differ:
- First email captures most replies. Instantly: 58% of all sequence replies come from the first touch. Belkins: single-email campaigns hit the highest per-email reply rate at 8.4%.
- First follow-up is a big lift. Belkins: +49% reply rate. Woodpecker: ~40% more replies than the opener.
- 1 to 3 email sequences average 9% reply rate. Woodpecker.
- 4 to 7 email sequences average 27% reply rate. Woodpecker (a 3x lift over short sequences, when measured cumulatively).
- Third email drops replies by 20%. Belkins (per-email basis, not cumulative).
- Fourth follow-up drops replies by 55% and pushes spam complaints from 0.5% to 1.6%, with unsubscribes climbing to 2%. Belkins.
The practical takeaway: 4 to 7 well-spaced follow-ups maximize total replies, but each follow-up after the first earns less and risks more, including a domain warmup setback that can take weeks to recover from. Stopping at 4 is usually safer than stretching to 7 unless every message in the sequence delivers fresh value.
Benchmarks by send timing
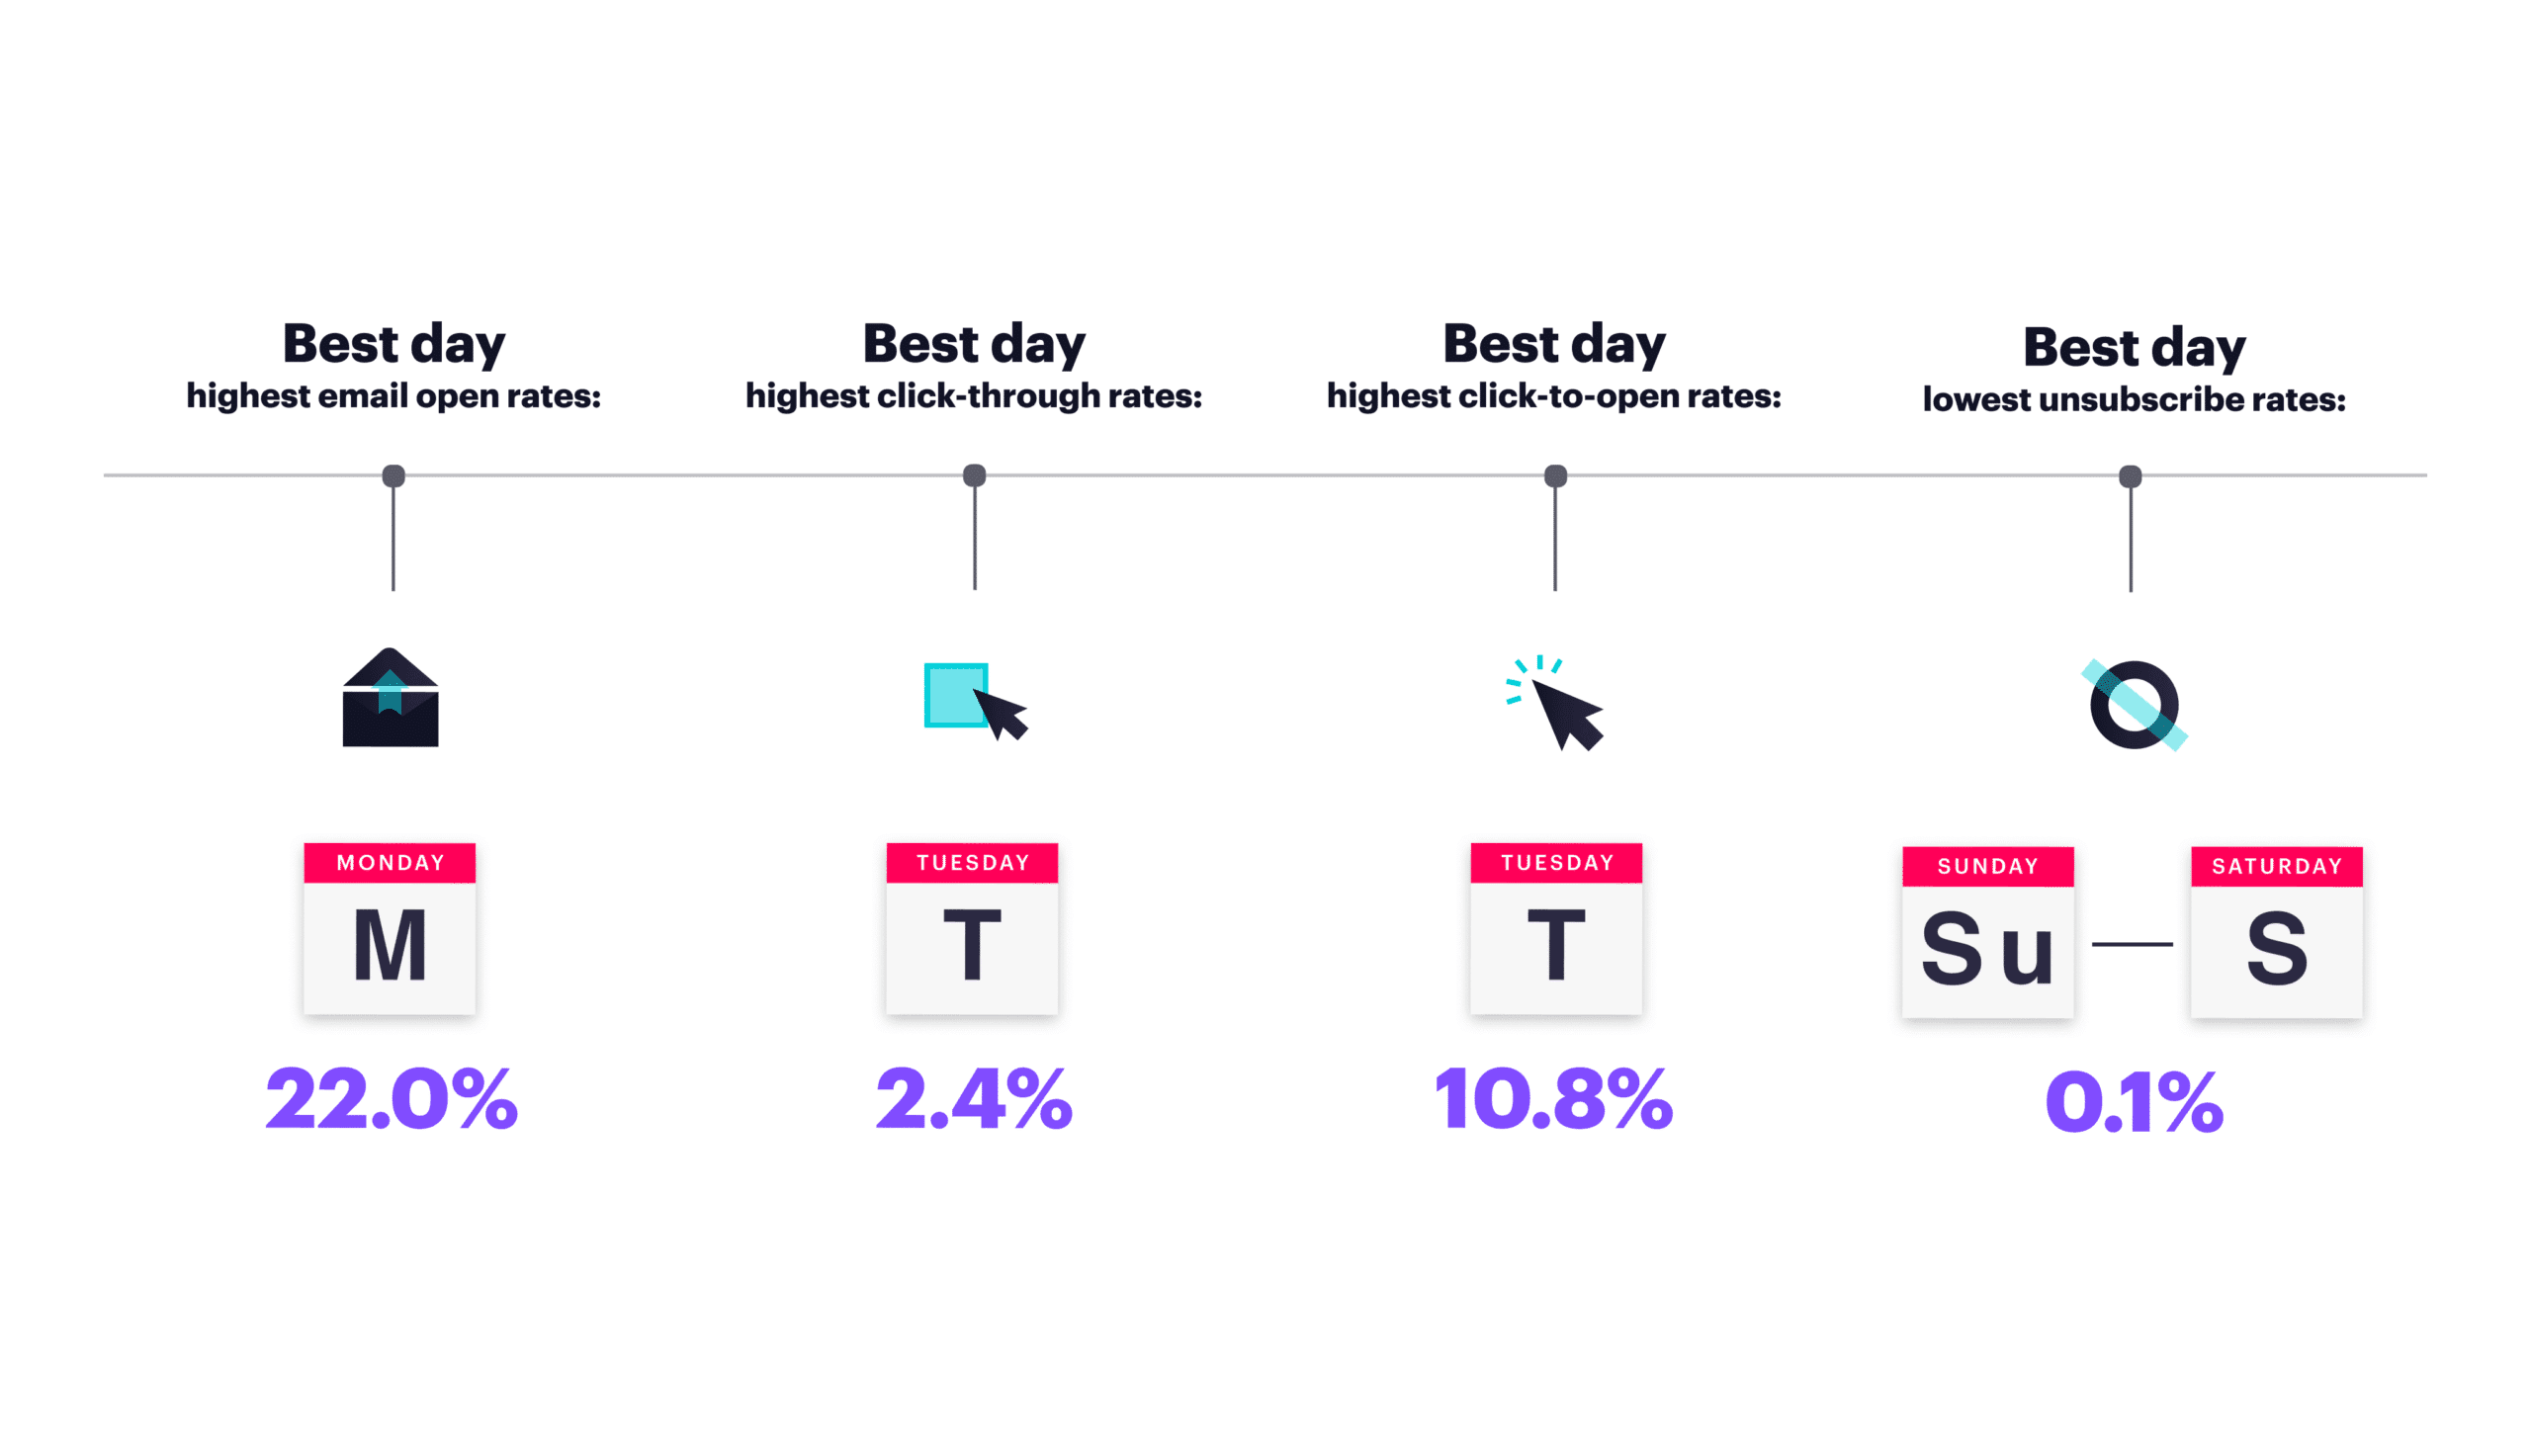
Timing benchmarks vary by dataset because of timezone mix and audience, but two patterns are consistent:
- Mid-week beats Monday and Friday. Belkins: Thursday hits 6.87% reply rate (top day). Mailforge: Wednesday 7 to 11 AM peaks. Instantly's playbook: Monday for fresh sequence launches, Wednesday peak for follow-ups, Friday for auto-reply triage.
- Evening sends can outperform mornings. Belkins: 8 to 11 PM sends reach 6.52% reply rate vs 5.29% at 5 to 8 AM.
- Avoid weekends and holidays. All studies skip these from their benchmark datasets because volume distorts the numbers.
None of these are universal: a US-East-Coast B2C audience and a global enterprise IT audience have different best windows. Treat the consensus as a starting point and let your own opens-by-hour graph correct it, the same way you would test a few LinkedIn opening lines before scaling a full multi-channel sequence.
Get your numbers above the benchmark
The four reports converge on the same short list of levers, and they all start before the send button.
- Verify the list before every send. A list with 3% bouncy or invalid addresses tanks placement on a fresh domain. Mailforge: well-maintained lists keep bounce under 3%; neglected lists hit 8%.
- Keep emails under 80 to 200 words. Instantly: under 80 words. Belkins: 6 to 8 sentences (50 to 125 words) hits 42.67% open and 6.9% reply.
- Lead with the prospect's problem. Instantly's elite-tier teams almost always open with the buyer's situation, not the seller's product.
- Personalize beyond the merge field. Woodpecker: emails with custom snippets above
{{first_name}}hit 17% reply rate vs 7% for non-personalized. - Warm the domain before bulk sends. Instantly: 5 to 10 daily emails initially, scaling over 4 to 6 weeks.
- Add a second channel. Mailforge: email + LinkedIn or phone calls produces 287% better results than email alone.
- Authenticate. SPF, DKIM, and DMARC are non-negotiable on a new sending domain. Without them, your benchmark conversation does not start.
A last note. Open rate is the metric most senders panic about and the one that matters least to revenue. Use it to spot deliverability problems, then optimize for reply rate, positive reply rate, and meeting bookings in that order. The numbers above are the floor; the levers in this section are what separate a 1% reply campaign from a 10% one.
BounceCheck Team
The team behind BounceCheck - helping businesses verify emails and improve deliverability.


